Venn Diagram Test - Short-cut Tricks And Examples
Type 1: Matching the Relationship
You will find a set of things in the question. You have to find the best diagram that fits the connection between the things. Below is an example to help you.
Example Question 1: Which of the following diagram indicates the best relation between Pen, Nib and Pencil?
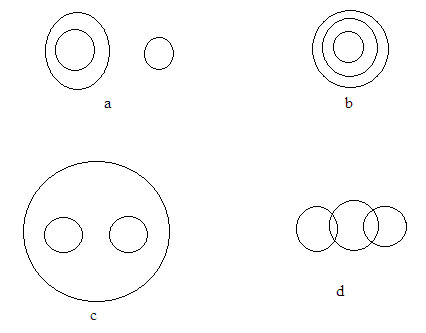
Answer: a
Reason:
The relation between pen, nib and pencil.
Nib is a component or part of pen and pencil is different from both.
Among the options, option a represents one circle inside the other i.e. nib is the part of pen and another circle individually which represent pencil that does not have relation with other two.
Type 2: Numbers (Data) Inside Diagram
In this type, you will find numbers (data) in Venn diagrams. You have to find the answers based on the data.
Below is an example question.
Example Question 2: In the below diagram, rectangle represents Dancer, triangle represents Singer and circle represents Dramatist.
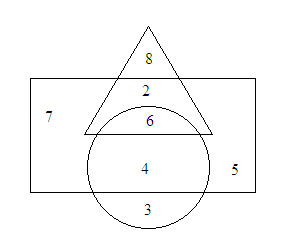
1. How many dancers are also singers?
a) 7 b) 5 c) 8 d) 2
Answer: c) 8
Reason:
Rectangle represents dancers. Triangle represents singers. To find the dancers who are also singers, see the overlap area between rectangle and triangle.
The overlap contains 6 and 2. Therefore, the answer is 6+2 = 8.
2. How many dramatist are both dancers and singers?
a) 6 b) 5 c) 8 d) 2
Answer: a) 6
3. how many singers are neither dancers nor dramatist?
a) 6 b) 4 c) 8 d) 2
Answer: a) 8
Reason:
You have to find the area that represents only singers and neither dancer nor dramatists. Therefore, you observe the part in triangle that is not a part of rectangle or circle.
The part of triangle separate from rectangle and circle contains 8.
Therefore, 8 is the answer.
No comments:
Post a Comment