Thursday, July 25, 2024

Science & Technology

DEVELOPMENT HISTORY
In 1947, with the emergence of a new
politically independent nation, India continued
to march ahead pursuing a programme of using
modern science and technology for national
development. Today India spends about 1.5 per
cent of its GNP on science and technology. In
this effort not only has India established
capabilities of its own but has also cooperated
with developed as well as developing countries
in its progress towards the use of science and
technology for national development.
Soon after Pandit Jawaharlal Nehru became
the Prime Minister of India, he created a Ministry
of Scientific Research and Natural Resources,
and actively supported the atomic energy
programme for peaceful purposes. In 1948, the
Atomic Energy Act was passed and the
Department of Atomic Energy was directly
under his charge. Till his death in 1964, he was
the Chairman of the Council of Scientific and
Industrial Research. His long association with
the India Science Congress Association is well
known. Under the farsighted leadership of
Nehru, the nation, the government and the
public leaders became committed to the
promotion of science and technology for
national development in a phased manner.
The enthusiastic efforts of Mr. Shanti Swarup
Bhatnagar led to the expansion of the Council
of Scientific and Industrial Research into a chain
of national laboratories spanning a wide
spectrum of science, technology, engineering
and biomedical sciences. The vision of Homi J.
Bhabha led to advanced research in nuclear
energy and other fundamental areas through the
creation of the Tata Institute of Fundamental
Research (TIFR) and what has now come to be
known as the Bhabha Atomic Research Center
(BARC), and the entire gamut of activities today
coming under the Atomic Energy Commission.
Soon after assuming office, Nehru appointed
a Scientific Man-power Committee and had the
satisfaction of seeing five Institutes of
Technology come up at Kharagpur, Bombay,
Madras, Kanpur and Delhi, besides a number
of regional engineering colleges. A number of
institutions for specialized training such as the
National Institute of Foundry and Forge
Technology, School of Planning and
Architecture, the Institutes of Management and
the All India Institute of Medical Sciences were
set up. A similar expansion took place in science
education. The number of universities and
science graduates and post-graduates
multiplied. Nehru diversified the area of
operation in science and technology. India was
the first country, originally on the foot-pound
system, to change over the metric system during
the present century. In 1948, Nehru directed the
SCIR to prepare a National Register of Scientific
and Technical Personnel. The Defence Science
Organisation was set up in 1948, on the advice
of Professor P.M.S. Blackett, for the scientific
evaluation of weapons and equipment,
operational research and special studies using
scientific technique.
Prime Minister, Indira Gandhi gave the
highest priority to self- reliance in science and
technology and the achievement of self-
sufficiency in food. In 1971, recognizing the
importance of developing integrated and self-
reliant electronic capabilities in the country, she
set up the Electronics Commission. There have
been many accomplishments in the field. To
ensure that developmental activities took place
in harmony with the environment, Mrs. Gandhi
created a new Department of Environment at
the Centre in 1980. It was at her initiative that
the first Indian scientific expedition to Antarctica
took place in December 1981. She was deeply
aware of the great importance of energy for
development and, in particular, the pressing
needs in rural areas. Accordingly, she set up a
Commission on Additional Sources of Energy in
March 1981, and thereafter a Department of
Non-Conventional Energy Source.
India’s development plans have consistently
emphasised the need for sustained investment
in research and related activities leading to
creation of substantial capacity and capabilities
in science and technology (S&T). The fruits of
this effort are evident in India’s nuclear and
space programmes, information and
communication technology services, automotive
and pharmaceuticals industries and other areas.
 As the Indian economy continues on the
path of rapid, more inclusive and sustainable
growth, it will be necessary to ensure that India’s
capabilities in S&T grow in strength. This is
especially important if India is to become one of
the major economies of the world over the next
20 years.
The country needs to move up from investing
1 per cent of gross domestic product (GDP) in
the R&D sector to 2 per cent of GDP and more,
as has been the case with several developed and
emerging economies for quite some time now.
This must be achieved not only through an
additional government effort, but also a much
increased private sector effort.
SCIENCE, TECHNOLOGY AND
INNOVATION POLICY 2013
New Science, Technology and Innovation
(STI) policy has been formulated and enunciated
in 2013 and was formally released at the 100th
Session of Indian Science Congress at Kolkata
on 3rd January, 2013 by the Prime Minister Dr.
Manmohan Singh. The policy seeks to focus on
both STI for people and people for STI. It aims
to bring all the benefits of Science, Technology
& Innovation to the national development and
sustainable and more inclusive growth. It seeks
the right sizing of the gross expenditure on
research and development by encouraging and
incentivizing private sector participation in R &
D, technology and innovation activities. Main
features of the STI policy 2013 include:
 Promoting the spread of scientific temper
amongst all sections of society.
 Enhancing skills for applications of science
among the young from all social sectors.
 Making careers in science, research and
innovation attractive enough for talented
and bright minds.
 Establishing world class infrastructure for
R&D for gaining global leadership in some
select frontier areas of science.
 Positioning India among the top five
global scientific powers by 2020 (by
increasing the share of global scientific
publications from 3.5 per cent to over 7
per cent and quadrupling the number of
papers in top 1 per cent journals from the
current levels).
 Linking contributions of Science Research
and innovation system with the inclusive
economic growth agenda and combining
priorities of excellence and relevance.
 Creating an environment for enhanced
private sector participation in R &D.
 Enabling conversion of R & D output with
societal and commercial applications by
replicating hitherto successful models, as
well as establishing of new PPP structures.
 Seeking S&T based high risk innovation
through new mechanisms.
 Fostering resource optimized cost-effective
innovation across size and technology
domains.
 Triggering in the mindset and value
systems to recognize respect and reward
performances which create wealth from
S&T derived knowledge.
 Creating a robust national innovation
system.
 Establishing linkages between discovery
processes of science and developmental
priorities of the country in agriculture,
manufacturing, services and infrastructure
sector.
SCIENCE AND TECHNOLOGY
POLICY-2003
The “Science and Technology Policy-2003”
envisages an implementation strategy for
revitalization of the Science & Technology
institutions in the country. The key elements of
the strategy include:
(i) S&T governance and investment;
(ii) Strengthening of infrastructure for
Science and Technology in academic
institutions;
(iii) New funding mechanisms for basic
research;
(iv) Human resource development;
(v) Optimal Utilization of Existing
Infrastructure and Competence;
(vi) Technology Development, Transfer and
Diffusion;
(vii) Indigenous Resources and Traditional
Knowledge;
(viii) Technologies for Mitigation and
Management of Natural Hazards;
(ix) Promotion of Innovation;
(x) Generation and Management of
Intellectual Property;
(xi) Industry and scientific R&D;
(xii) Public Awareness of Science and
Technology; and
(xii) International Science and Technology
cooperation.
TECHNOLOGY MISSIONS
The “Technology Missions” were the brain
child of Mr. Rajiv Gandhi. The missions started
in 1985 and were an offshoot of the Seventh Plan.
Launched in the fields of literacy, immunization,
oilseeds, drinking water, dairy products and
telecommunication, it had the following aims:
1. Make a substantial improvement in the
literacy level of the population.
2. Immunize all infants against six diseases and
women against tetanus.
3. Cut down imports of edible oils.
4. Improve the availability and quality of
drinking water in rural areas.
5. Improve milk production and rural
employment.
6. Extend and improve the telecommunication
network especially in the rural areas.
In the light of the new industrial and
economic policies adopted by the Government,
the approach to technology development has
had to be fine-tuned. Besides enhancing the flow
of technology from abroad, the Department of
Electronics has decided to launch a series of
Technology Missions, essentially to meet the
following three objectives:
(a) Strengthening the technology base
infrastructure.
(b) Commercializing indigenous technolog-
ies which improve the performance of
selected industries and their
competitiveness.
(c) Focus attention on certain emerging and
frontier technologies.
SCIENCE AND TECHNOLOGY
INFRASTRUCTURE
Besides having the third largest scientific
manpower, India also possess a large
infrastructural network. Scientific and
technological activities in India can be classified
into these sectors, viz., (i) Central government;
(ii) State government; (iii) higher education
sector; (iv) public sector industry and; (v) non-
profit institutions/associations. These
institutional structures comprise mainly of major
scientific departments of the Central
Government, with their research laboratories,
institutions, which are the main contributors to
the research activities being carried out in the
country. These are the Indian Council of
Agricultural Research (ICAR), Indian Council
of Medical Research (ICMR), the Department of
Atomic Energy (DAE), Defence Research and
Development Organisation (DRDO),
Department of Ocean Development (DOD),
Department of Environment (DOE), and
Ministry of Science and Technology comprising
of three departments-Science and Technology,
Scientific and Industrial Research and
Biotechnology. Besides, there are other Central
Government ministries/departments and
number of research institutions under their
administrative and financial control. In addition,
there are in-house R & D units of public-sector
undertakings. The private sector industries have
established their own in-house R & D units,
which are responsible for undertaking R & D
activities for their respective industries. The state
governments have their own research institution,
which mainly comprise agriculture universities
and their research stations besides having other
research institutions directly under different
departments of the state governments.
Infrastructure for education, research and
development has expanded enormously over the
years.
ORGANISATIONS UNDER CSIR
CBRI Central Building Research Institute Roorkee (Uttarakhand)
CCMB Centre for Cellular and Molecular Biology Hyderabad
CDRI Central Drug Research Institute Lucknow
CECRI Central Electro Chemical Research Institute Karaikudi (T.N.)
CEERI Central Electronics Engineering Research Institute Pilani (Raj)
CFRI Central Fuel Research Institute Dhanbad
CFTRI Central Food Technological Research Institute Mysore
CGCRI Central Glass and Ceramic Research Institute Kolkata
CIMAP Central Institute of Medicinal and Aromatic Plants Lucknow
CLRI Central Leather Research Institute Chennai
CMERI Central Mechanical Engineering Research Institute Durgapur (W.B.)
CMRI Central Mining Research Institute Dhanbad
CRRI Central Road Research Institute New Delhi
CSIO Central Scientific Instruments Organization Chandigarh
CSIR Council of Scientific and Industrial Research New Delhi
IHBT Institute of Himalayan Bioresource Technology Palampur (H.P.)
CSMCI Central Salt and Marine Chemicals Research Institute Bhavnagar (Guj.)
ERDA Electronics Research and Development Association Vadodara
IICB Indian Institute of Chemical Biology Kolkata
IICT Indian Institute of Chemical Technology Hyderabad
IIP Indian Institute of Petroleum Dehradun
IMT Institute of Microbial Technology Chandigarh
INSDOC Indian National Scientific Documentation Centre New Delhi
ITRC Industrial Toxicology Research Centre Lucknow
NAL National Aerospace Laboratory Bangalore
NBRI National Botanical Research Institute Lucknow
NCL National Chemical Laboratory Pune
NEERI National Environmental Engineering Research Institute Nagpur
NGRI National Geophysical Research Institute Hyderabad
NIO National Institute of Oceanography and Development Studies Panaji, Goa
NISTADS National Institute of Science, Technology and New Delhi
Development Studies
NML National Metallurgical Laboratory Jamshedpur
NPL National Physical Laboratory New Delhi
PID Publication and Information Directorate Delhi
RRL Regional Research Laboratory Bhopal, Jorhat,
Thiruvananthapuram,
Jammu, Bhubaneswar
TES Tocklai Experimental Station
SERC Structural Engineering Research Centre Chennai
Tuesday, July 23, 2024

Units and Measurements

All the quantities in terms of which
laws of physics are described and whose
measurement is essential are called physical
quantities like mass, length, time, light,
current electricity, temperature, etc.
UNIT
The fixed part of a Physical quantity by
dint of which comparision could be made
of the magnitudes of the same quantity
contained in different substances is termed
as a unit.
Systems of units Length Mass Time
1. C.G.S. System Centimetre Gram Second
2. F.P.S. System Foot Pound Second
3. M.K.S. System Metre Kilogram Second
The measurement of a physical quantity
requires a unit and the comparision of unit
to the quantity & the number of the units
obtained gives the measured value of the
quantity e.g. when we say that the length of
a rod is 5 metres it means that the length of
the rod is 5 times the unit of length, metre.
 FUNDAMENTAL UNITS
(i) Metre (m) : 1 metre is equal to the
length of the path travelled by light in
vacuum in 1/2 99792458 of a second where
speed of light is 299792458 m/s. Recently,
the definition of 1 metre of length is realized
by using the iodine stabilized helium neon
lasers.
(ii) Kilogram (kg) : A standard block of
Platinum Iridium alloy preserved in the
International Bureau of Weights & Measures
at Sevres, near Paris, France is used as a
prototype of unit of mass and one kilogram
is equal to the mass of this alloy.
(iii) Second (s) : The definition of second
is based on an atomic clock which works
on energy radiation from an isotope of
caesium (Cs-133). One second is equal to
the duration of 9, 192, 631, 770 periods of
International System of Units (S.I.)
The system is a modification over the MKS system
and hence, is known as rationalised MKS System.
There are seven fundamental and two supplemen-
tary units in S. I. System :
Physical Fundamental Symbol
1. Mass Kilogram kg
2. Length Metre m
3. Time Second s
4. Tempertature Kelvin K
5. Electric-current Ampere A
6. Luminous intensity Candela Cd
7. Quantity of matter Mole mol
Supplementary Supplementary Symbol
Physical quantity Unit
1. Plane angle Radian rad.
2. Solid angle Steradian sr
The units of three quantities viz mass,
length and time are called fundamental
units because all physical quatities can be
expressed in terms of mass, length and
time and remaining all units are called
derived units.
radiation corresponding to unperturbed
transition between the two specific energy
levels of the ground gaseous state of Cs-
133 isotope. The caesium atoms in the
atomic clock act like a pendulum in a
pendulum clock. The atomic clock gives
the most accurate time with an error of 1
second only in 5000 years.
IMPORTANT PRACTICAL UNITS
For Lengths : (i) Astronomical Unit
(A.U) : It is equal to the distance between
the centre of the earth and the centre of the
sun. One A.U. = 1.5 × 10¹¹m.
(ii) Light Year (ly) : It is equal to the
distance travelled by light in vacuum in
one year. 1 light year = 9.46 × 10¹⁵m.
 ■ ■ ■
(iii) Par sec. (Parallactic second) : 1
Par sec = 3.1 × 10¹⁶m = 3.26 ly
(iv) 1 micrometre or 1 micron = 10–6m
(v) 1 nanometre (1nm) = 10–9m
(vi) 1 Angstrom (1A°) = 10–10m
For Masses : (i) 1 tonne or 1 metric ton
= 1000 kg
(ii) 1 pound (lb) = 0.4536 kg.
(iii) The largest unit of mass is Chandra
Shekher Limit (C.S.L) 1 C.S.L. = 1.4 times
the mass of the Sun.
(iv) For small masses atomic mass unit
(a.m.u.) is used. 1 a.m.u = 1.6 × 10⁻²⁷kg.
For Area : (i) 1 acre = 4047 m2
.
(ii) 1 hectare = 10⁴
m2
.

Chalcolithic Period

Chalcolithic Period
• The end of the Neolithic period saw the use of 
metals of which copper was the fi rst. A culture 
based on the use of stone and copper arrived called 
the Chalcolithic phase meaning the stone-copper 
phase.
• The fi rst full-fl edged village communities evolved 
in the Chalcolithic phase which was chronologically 
antecedents to Harappan people. Rafi que Mughal 
of Pakistan named there settlements as Early 
Harappan culture.
• Though some Chalcolithic cultures are 
contemporary of Harappan and some of pre-
Harappan cultures but most Chalcolithic cultures 
are post-Harappan.
• Though Chalcolithic cultures mostly used stone and 
copper implements, the Harappans used bronze (an 
alloy of copper and tin) on such a scale that Harappan 
culture is known as a Bronze Age Culture.
• Apart from stone tools, hand axes and other objects 
made from copperware were also used.
• The evidences of relationship with Afghanistan, 
Iran and probably Central India and visible at 
Mehargarh.
• The Chalcolithic culture at many places continued 
till 700 B.C. nd sometime around 1200 B.C. the use 
of iron seems to have begun in the Chalcolithic level 
itself. The use of iron subsequently revolutionized 
the culture making progress and by 800 B.C. a 
distinct Iron Age came into existence
• The Chalcolithic people used different types of 
pottery of which black and red pottery was most 
popular. It was wheel made and painted with 
white line design.
• The Chalcolithic people were not acquainted with 
burnt bricks and generally lived in thatched houses. 
It was a village economy.
• They venerated the mother goddess and 
worshipped the bull.
Sites
• Important sites of this stage are spread in 
Rajasthan, Maharashtra, West Bengal, Bihar, 
Madhya Pradesh, etc.
• The Chalcolithic culture in Rajasthan is known as 
Banas culture after the river of the same name and 
is also known as Ahar culture after the typesite.
• In the Malwa region the important Chalcolithic 
sites are Nagda, Kayatha, Navdatoli, and Eran. 
Mud-plastered fl oors are a prominent feature of 
Kayatha.
• The Kayatha culture is characterized by a sturdy 
red-slipped ware painted with designs in chocolate 
colour, a red painted buff ware and a combed ware 
bearing incised patterns.
• The Ahar people made a distinctive black-and-red 
ware decorated with white designs.
• The Malwa ware is rather coarse in fabric, but has 
a thick buff surface over which designs are made 
either in red or black.
• The Prabhas and Rangpur wares are both derived 
from the Harappan, but have a glossy surface due 
to which they are also called Lustrous Red Ware.
• Jorwe ware too is painted black-on-red but has a 
matt surface treated with a wash.
• The settlements of Kayatha cutlure are only a few 
in number, mostly located on the Chambal and its 
tributaries. They are relatively small in size and the 
biggest may be not over two hectares.
• In contrast to small Kayatha culture settlements 
those of Ahar cultures are big. At least three of 
them namely Ahar, Balathal and Gilund are of 
several hectares.
• Stone, mud bricks and mud were used for the 
construction of houses and other structures.
• Excavations reveal that Balathal was a well-
fortifi ed settlement.
• The people of Malwa culture settled mostly on 
the Narmada and its tributaries. Navdatoli, Eran 
and Nagada are the three best known settlements 
of Malwa culture. Navadatoli measures almost 
10 hectares and is one of the largest Chalcolithic 
settlements.
• It has been seen that some of these sites were 
fortifi ed and Nagada had even a bastion of mud-
bricks. Eran similarly had a fortifi cation wall with 
a moat.
• The Rangpur culture sites are located mostly on 
Ghelo and Kalubhar rivers in Gujarat.
• The Jorwe settlement is comparatively larger in 
number.
• Prakash, Daimabad and Inamgaon are some of 
the best known settlements of this culture. The 
largest of these is Daimabad which measured 20 
hectares.
• From Mesolithic culture onwards, all the culture 
types coexisted and interacted with each other.
Lifestyle
• The Chalcolithic people built rectangular and 
circular houses of mud wattled-and-daub. The 
circular houses were mostly in clusters. These 
houses and huts had roots of straw supported on 
bamboo and wooden rafters. Floors were made 
of rammed clay and huts were used for storage 
also.
• People raised cattle as well as cultivated both Kharif 
and Rabi crops in rotation. Wheat and barley were 
grown in the area of Malwa. Rice is reported to have 
been found from Inamgaon and Ahar. These people 
also cultivated jowar and bajra and so also kulthi 
ragi, green peas, lentil and green and black grams.
• Religion was an important aspect which interlinked 
all Chalcolithic cultures. The worship of mother 
goddess and the bull was in vogue. The bull cult 
seems to have been predominant in Malwa during 
the Ahar period.
• A large number of these both naturalistic as well as 
stylised lingas have been found from most of the 
sites of Chalcolithic settlements. The naturalistic 
ones may have served as votive offerings, but the 
small stylised ones may have been hung around 
the neck as the Lingayats do today.
• The Mother Goddess is depicted on a huge storage 
jar of Malwa culture in an applique design. She is 
fl anked by a woman on the right and a crocodile 
on the left, by the side of which is represented the 
shrine.
• Likewise the fiddle-shaped figurines probably 
resembling Srivatsa, the symbol of Lakshmi, the 
Goddess of wealth in historical period represent a 
mother Goddess.
• In a painted design on a pot, a deity is shown with 
dishevelled hair, recalling Rudra.
• A painting on a jar found from Daimabad shows 
a deity surrounded by animals and birds such as 
tigers and peacocks. Some scholars compare it 
with the ‘Shiva Pashupati’ depicted on a seal from 
Mohenjodaro.
Two fi gurines from Inamgaon, belonging to late 
Jorwe culture, are identifi ed as proto-Ganesh, who 
is worshipped for success. 
• Several headless figurines found at Inamgaon 
have been compared with Goddess Visira of the 
Mahabharata.
• Fire-worship seems to have been a very widespread 
phenomenon among the Chalcolithic people of 
Pre-historic India as fi re-altars have been found 
from a large number of Chalcolithic sites during 
the course of excavations.
• The occurence of pots and other funerary objects 
found along with burials of the Malwa and Jorwe 
people indicate that people had a belief in life after 
death.
• The Chalcolithic farmers had made considerable 
progress in ceramic as well as metal technology. 
The painted pottery was well made and well fi red 
in kiln, it was fi red at a temperature between 500-
700°C.
• In metal tools we fi nd axes, chisels, bangles, beads, 
etc. mostly made of copper. The copper was obtained, 
perhaps, from the Khetri mines of Rajasthan.
• Gold ornaments were extremely rare and have been 
found only in the Jorwe culture.
• An ear ornament has been found from Prabhas in 
the Godavari valley also.
• The fi nd of crucibles and pairs of tongs of copper 
at Inamgaon in Maharashtra shows the working of 
goldsmiths.
• Chalcedony drills were used for perforating beads 
of semi-precious stones.
• Lime was prepared out of Kankar and used for 
various purposes like painting houses and lining 
the storage bins, etc.

Friday, June 28, 2024

Atomic Structure

Atoms are the building blocks of elements. They are the smallest parts of an element that chemically react. The first atomic theory, proposed by John Dalton in 1808, regarded atom as the ultimate indivisible particle of matter. Towards the end of the nineteenth century, it was proved experimentally that atoms are divisible and consist of three fundamental particles: electrons, protons and neutrons. The discovery of sub-atomic particles led to the proposal of various atomic models to explain the structure of atom.
Thomson in 1898 proposed that an atom consists of uniform sphere of positive electricity with electrons embedded into it. This model in which mass of the atom is considered to be evenly spread over the atom was proved wrong by Rutherford’s famous alpha-particle scattering experiment in 1909. Rutherford concluded that atom is made of a tiny positively charged nucleus, at its centre with electrons revolving around it in circular orbits. Rutherford model, which resembles the solar system, was no doubt an improvement over Thomson model but it could not account for the stability of the atom i.e., why the electron does not fall into the nucleus. Further, it was also silent about the electronic structure of atoms i.e., about the distribution and relative energies of electrons around the nucleus. The difficulties of the Rutherford model were overcome by Niels Bohr in 1913 in his model of the hydrogen atom. Bohr postulated that electron moves around the nucleus in circular orbits. Only certain orbits can exist and each orbit corresponds to a specific energy. Bohr calculated the energy of electron in various orbits and for each orbit predicted the distance between the electron and nucleus. Bohr model, though offering a satisfactory model for explaining the spectra of the hydrogen atom, could not explain the spectra of multi-electron atoms. The reason for this was soon discovered. In Bohr model, an electron is regarded as a charged particle moving in a well defined circular orbit about the nucleus. The wave character of the electron is ignored in Bohr’s theory. An orbit is a clearly defined path and this path can completely be defined only if both the exact position and the exact velocity of the electron at the same time are known. This is not possible according to the Heisenberg uncertainty principle. Bohr model of the hydrogen atom, therefore, not only ignores the dual behaviour of electron but also contradicts Heisenberg uncertainty principle. 
Erwin Schrödinger, in 1926, proposed an equation called Schrödinger equation to describe the electron distributions in space and the allowed energy levels in atoms. This equation incorporates de Broglie’s concept of wave-particle duality and is consistent with Heisenberg uncertainty principle. When Schrödinger equation is solved for the electron in a hydrogen atom, the solution gives the possible energy states the electron can occupy [and the corresponding wave function(s) (ψ) (which in fact are the mathematical functions) of the electron associated with each energy state]. These quantized energy states and corresponding wave functions which are characterized by a set of three quantum numbers (principal quantum number n, azimuthal quantum number l and magnetic quantum number ml) arise as a natural consequence in the solution of the Schrödinger equation. The restrictions on the values of these three quantum numbers also come naturally from this solution. The quantum mechanical model of the hydrogen atom successfully predicts all aspects of the hydrogen atom spectrum including some phenomena that could not be explained by the Bohr model.
According to the quantum mechanical model of the atom, the electron distribution of an atom containing a number of electrons is divided into shells. The shells, in turn, are thought to consist of one or more subshells and subshells are assumed to be composed of one or more orbitals, which the electrons occupy. While for hydrogen and hydrogen like systems (such as He+, Li2+ etc.) all the orbitals within a given shell have same energy, the energy of the orbitals in a multi-electron atom depends upon the values of n and l: The lower the value of (n + l ) for an orbital, the lower is its energy. If two orbitals have the same (n + l ) value, the orbital with lower value of n has the lower energy. In an atom many such orbitals are possible and electrons are filled in those orbitals in order of increasing energy in accordance with Pauli exclusion principle (no two electrons in an atom can have the same set of four quantum numbers) and Hund’s rule of maximum multiplicity (pairing of electrons in the orbitals belonging to the same subshell does not take place until each orbital belonging to that subshell has got one electron each, i.e., is singly occupied). This forms the basis of the electronic structure of atoms.

Monday, June 3, 2024

Laws of Motion

We saw that uniform motion needs the concept of velocity alone whereas non-uniform motion requires the concept of acceleration in addition. So far, we have not asked the question as to what governs the motion of bodies. In this chapter, we turn to this basic question.
Let us first guess the answer based on our common experience. To move a football at rest, someone must kick it. To throw a stone upwards, one has to give it an upward push. A breeze causes the branches of a tree to swing; a strong wind can even move heavy objects. A boat moves in a flowing river without anyone rowing it. Clearly, some external agency is needed to provide force to move a body from rest. Likewise, an external force is needed also to retard or stop motion. You can stop a ball rolling down an inclined plane by applying a force against the direction of its motion.
In these examples, the external agency of force (hands, wind, stream, etc) is in contact with the object. This is not always necessary. A stone released from the top of a building accelerates downward due to the gravitational pull of the earth. A bar magnet can attract an iron nail from a distance. This shows that external agencies (e.g. gravitational and magnetic forces ) can exert force on a body even from a distance.
In short, a force is required to put a stationary body in motion or stop a moving body, and some external agency is needed to provide this force. The external agency may or may not be in contact with the body. 

Sunday, June 2, 2024

Mechanical Properties of Solids at a Glance

1. Stress is the restoring force per unit area and strain is the fractional change in dimension. In general there are three types of stresses (a) tensile stress — longitudinal stress (associated with stretching) or compressive stress (associated with compression), (b) shearing stress, and (c) hydraulic stress. 

2. For small deformations, stress is directly proportional to the strain for many materials. This is known as Hooke’s law. The constant of proportionality is called modulus of elasticity. Three elastic moduli viz., Young’s modulus, shear modulus and bulk modulus are used to describe the elastic behaviour of objects as they respond to deforming forces that act on them.
A class of solids called elastomers does not obey Hooke’s law.

3. When an object is under tension or compression, the Hooke’s law takes the form
F/A = Y∆L/L
where ∆L/L is the tensile or compressive strain of the object, F is the magnitude of the applied force causing the strain, A is the cross-sectional area over which F is applied (perpendicular to A) and Y is the Young’s modulus for the object. The stress is F/A.

4. A pair of forces when applied parallel to the upper and lower faces, the solid deforms so that the upper face moves sideways with respect to the lower. The horizontal displacement ∆L of the upper face is perpendicular to the vertical height L. This type of deformation is called shear and the corresponding stress is the shearing stress. This type of stress is possible only in solids.
In this kind of deformation the Hooke’s law takes the form
F/A = G × ∆L/L

where ∆L is the displacement of one end of object in the direction of the applied force F, and G is the shear modulus.

5. When an object undergoes hydraulic compression due to a stress exerted by a surrounding fluid, the Hooke’s law takes the form
p = B (∆V/V), 
where p is the pressure (hydraulic stress) on the object due to the fluid, ∆V/V (the volume strain) is the absolute fractional change in the object’s volume due to that pressure and B is the bulk modulus of the object.

6. In the case of a wire, suspended from celing and stretched under the action of a weight (F) suspended from its other end, the force exerted by the ceiling on it is equal and opposite to the weight. However, the tension at any cross-section A of the wire is just F and not 2F. Hence, tensile stress which is equal to the tension per unit area is equal to F/A.

7. Hooke’s law is valid only in the linear part of stress-strain curve.

8. The Young’s modulus and shear modulus are relevant only for solids since only solids have lengths and shapes.

9. Bulk modulus is relevant for solids, liquid and gases. It refers to the change in volume when every part of the body is under the uniform stress so that the shape of the body remains unchanged. 

10. Metals have larger values of Young’s modulus than alloys and elastomers. A material with large value of Young’s modulus requires a large force to produce small changes in its length. 

11. In daily life, we feel that a material which stretches more is more elastic, but it a is misnomer. In fact material which stretches to a lesser extent for a given load is considered to be more elastic.

12. In general, a deforming force in one direction can produce strains in other directions also. The proportionality between stress and strain in such situations cannot be described by just one elastic constant. For example, for a wire under longitudinal strain, the lateral dimensions (radius of cross section) will undergo a small change, which is described by another elastic constant of the material (called Poisson ratio).

13. Stress is not a vector quantity since, unlike a force, the stress cannot be assigned a specific direction. Force acting on the portion of a body on a specified side of a section has a definite direction.

Friday, May 31, 2024

Ideal-gas Equation and Absolute Temperature

Ideal-gas Equation and Absolute Temperature

Liquid-in-glass thermometers show different readings for temperatures other than the fixed points because of differing expansion properties. A thermometer that uses a gas, however, gives the same readings regardless of which gas is used. Experiments show that all gases at low densities exhibit same expansion behaviour. The variables that describe the behaviour of a given quantity (mass) of gas are pressure, volume, and temperature (P, V, and T)(where T = t + 273.15; t is the temperature in °C). When temperature is held constant, the pressure and volume of a quantity of gas are related as pv = constant.

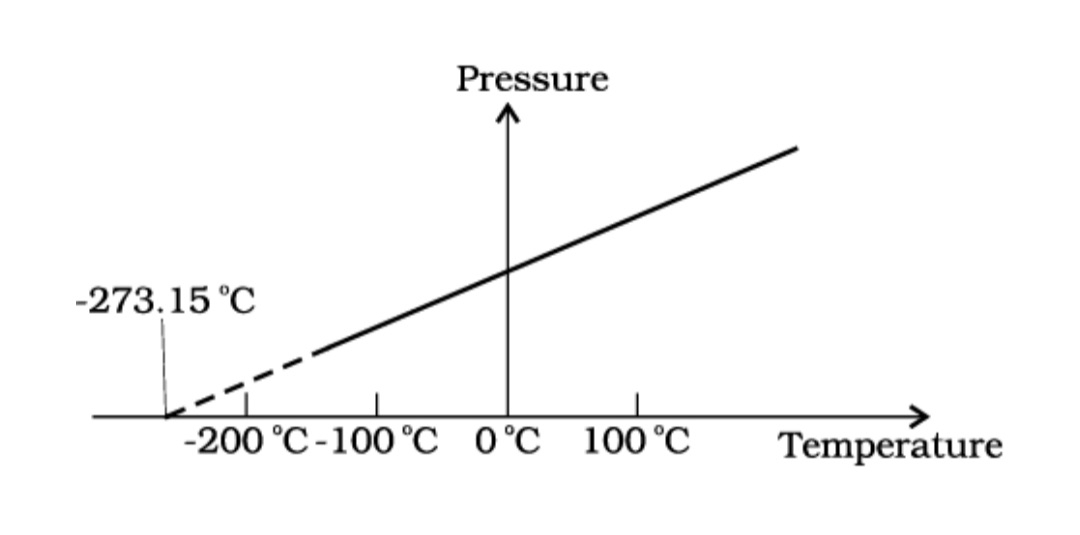
Fig. 1
Pressure versus temperature of a low density gas kept at constant volume.  
This relationship is known as Boyle’s law, after Robert Boyle (1627–1691), the English Chemist who discovered it. When the pressure is held constant, the volume of a quantity of the gas is related to the temperature as V/T = constant. This relationship is known as Charles’ law, after French scientist Jacques Charles (1747–1823). Low-density gases obey these laws, which may be combined into a single relationship. Notice that since pV = constant and V/T = constant for a given quantity of gas, then pV/T should also be a constant. This relationship is known as ideal gas law. It can be written in a more general form that applies not just to a given quantity of a single gas but to any quantity of any low-density gas and is known as ideal-gas equation:
PV/T = µR
or PV = µRT ....... 1
where, µ is the number of moles in the sample of gas and R is called universal gas constant:
R = 8.31 J mol–1 K–1
In Eq. 1, we have learnt that the pressure and volume are directly proportional to temperature : PV ∝ T. This relationship allows a gas to be used to measure temperature in a constant volume gas thermometer. Holding the volume of a gas constant, it gives P ∝T. Thus, with a constant-volume gas thermometer, temperature is read in terms of pressure. A plot of pressure versus temperature gives a straight line in this case, as shown in Fig.1
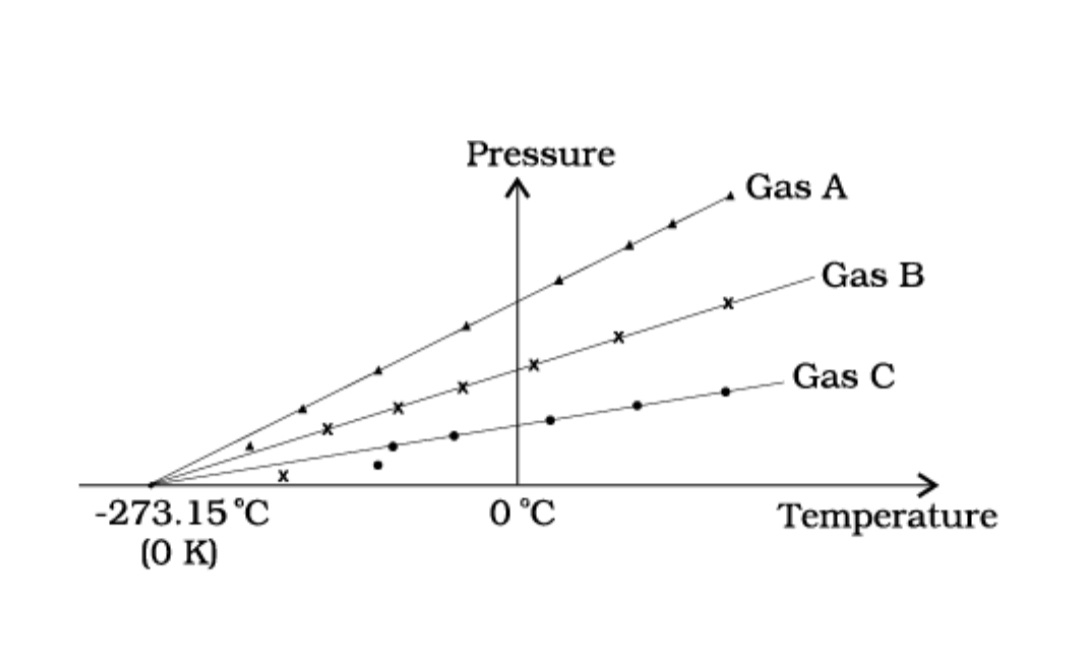
However, measurements on real gases deviate from the values predicted by the ideal gas law at low temperature. But the relationship is linear over a large temperature range, and it looks as though the pressure might reach zero with decreasing temperature if the gas continued to be a gas. The absolute minimum temperature for an ideal gas, therefore, inferred by extrapolating the straight line to the axis, as in Fig. 10.3. This temperature is found to be 
– 273.15 °C and is designated as absolute zero. Absolute zero is the foundation of the Kelvin temperature scale or absolute scale temperature named after the British scientist Lord Kelvin. On this scale, – 273.15 °C is taken as the zero point, that is 0 K (Fig. 2). 
  Fig.2 A plot of pressure versus temperature and extrapolation of lines for low density gases indicates the same absolute zero temperature.  


  Fig.3 Comparision of the Kelvin, Celsius and Fahrenheit temperature scales.  
  The size of unit in Kelvin and Celsius temperature scales is the same. So, temperature on these scales are related by
T = tC + 273.15      (3)

Recently Added

Video Lectures


Available Educational Materials