Ideal-gas Equation and Absolute Temperature
Liquid-in-glass thermometers show different readings for temperatures other than the fixed points because of differing expansion properties. A thermometer that uses a gas, however, gives the same readings regardless of which gas is used. Experiments show that all gases at low densities exhibit same expansion behaviour. The variables that describe the behaviour of a given quantity (mass) of gas are pressure, volume, and temperature (P, V, and T)(where T = t + 273.15; t is the temperature in °C). When temperature is held constant, the pressure and volume of a quantity of gas are related as pv = constant.
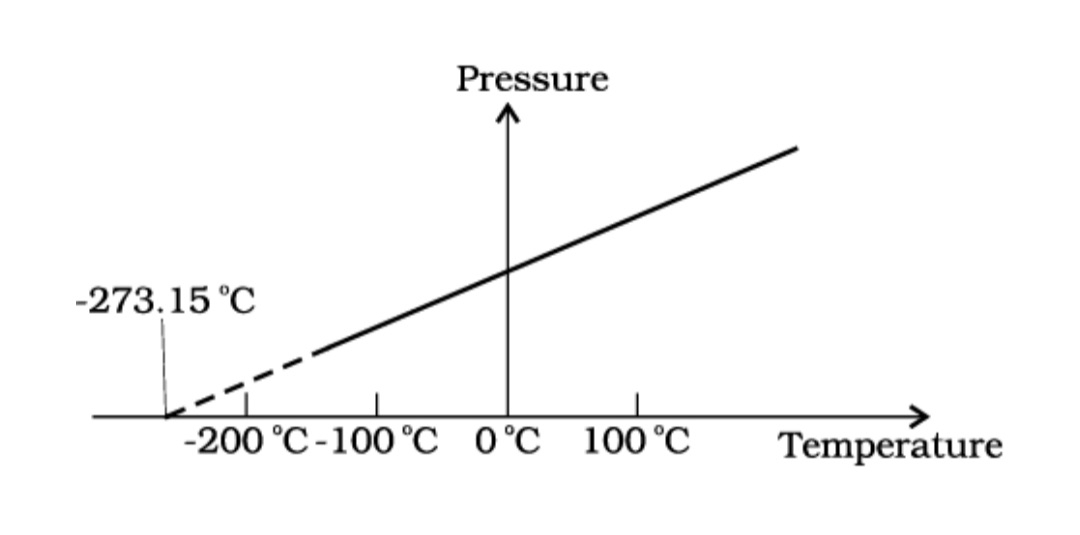
Pressure versus temperature of a low density gas kept at constant volume.
This relationship is known as Boyle’s law, after Robert Boyle (1627–1691), the English Chemist who discovered it. When the pressure is held constant, the volume of a quantity of the gas is related to the temperature as V/T = constant. This relationship is known as Charles’ law, after French scientist Jacques Charles (1747–1823). Low-density gases obey these laws, which may be combined into a single relationship. Notice that since pV = constant and V/T = constant for a given quantity of gas, then pV/T should also be a constant. This relationship is known as ideal gas law. It can be written in a more general form that applies not just to a given quantity of a single gas but to any quantity of any low-density gas and is known as ideal-gas equation:
PV/T = µR
or PV = µRT ....... 1
where, µ is the number of moles in the sample of gas and R is called universal gas constant:
R = 8.31 J mol–1 K–1
In Eq. 1, we have learnt that the pressure and volume are directly proportional to temperature : PV ∝ T. This relationship allows a gas to be used to measure temperature in a constant volume gas thermometer. Holding the volume of a gas constant, it gives P ∝T. Thus, with a constant-volume gas thermometer, temperature is read in terms of pressure. A plot of pressure versus temperature gives a straight line in this case, as shown in Fig.1
However, measurements on real gases deviate from the values predicted by the ideal gas law at low temperature. But the relationship is linear over a large temperature range, and it looks as though the pressure might reach zero with decreasing temperature if the gas continued to be a gas. The absolute minimum temperature for an ideal gas, therefore, inferred by extrapolating the straight line to the axis, as in Fig. 10.3. This temperature is found to be
– 273.15 °C and is designated as absolute zero. Absolute zero is the foundation of the Kelvin temperature scale or absolute scale temperature named after the British scientist Lord Kelvin. On this scale, – 273.15 °C is taken as the zero point, that is 0 K (Fig. 2).
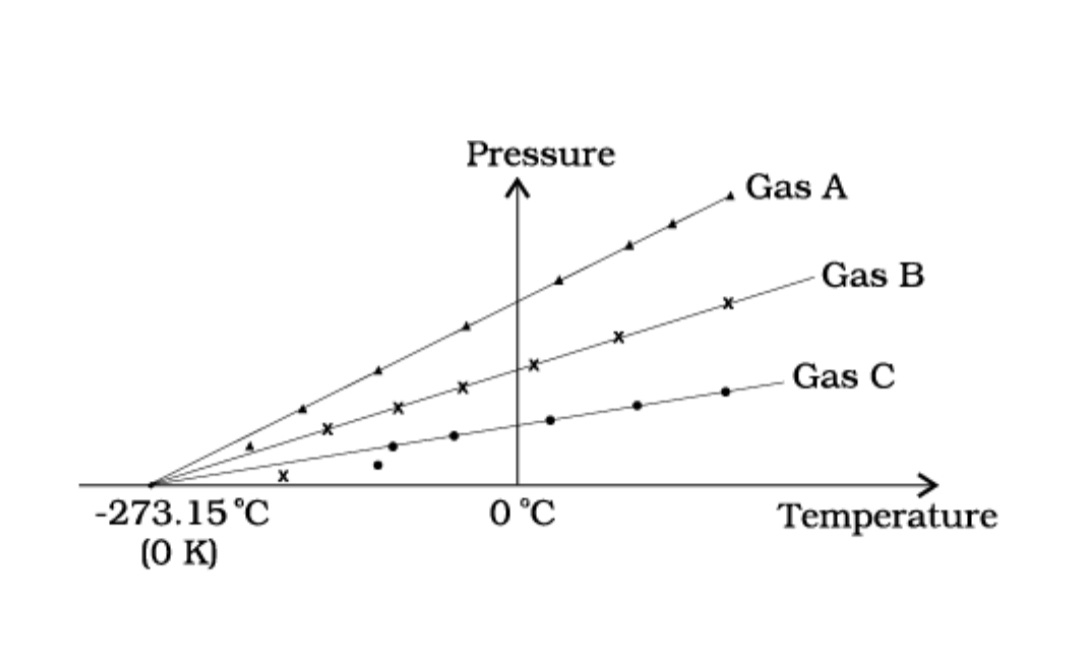
Fig.2 A plot of pressure versus temperature and extrapolation of lines for low density gases indicates the same absolute zero temperature.

Fig.3 Comparision of the Kelvin, Celsius and Fahrenheit temperature scales.
The size of unit in Kelvin and Celsius temperature scales is the same. So, temperature on these scales are related by
T = tC + 273.15 (3)